Smart Drone & AI Inspection

Solar Inspection Platform
by Drone with AI

Detect faults, optimize performance and reduce costs with automated drone inspections and AI-powered classification.

20+

Inspected Plants

50+ MWp

Inspected Power

100k+

Inspected Panels

99.9%

Detection Rate

Companies that trust STEMIS
Aevo
DQD
Apodi
Gerasol
Renovolt
5G Solar
GoodWe
Canal Solar
Solax
AP
Exata
Gerar

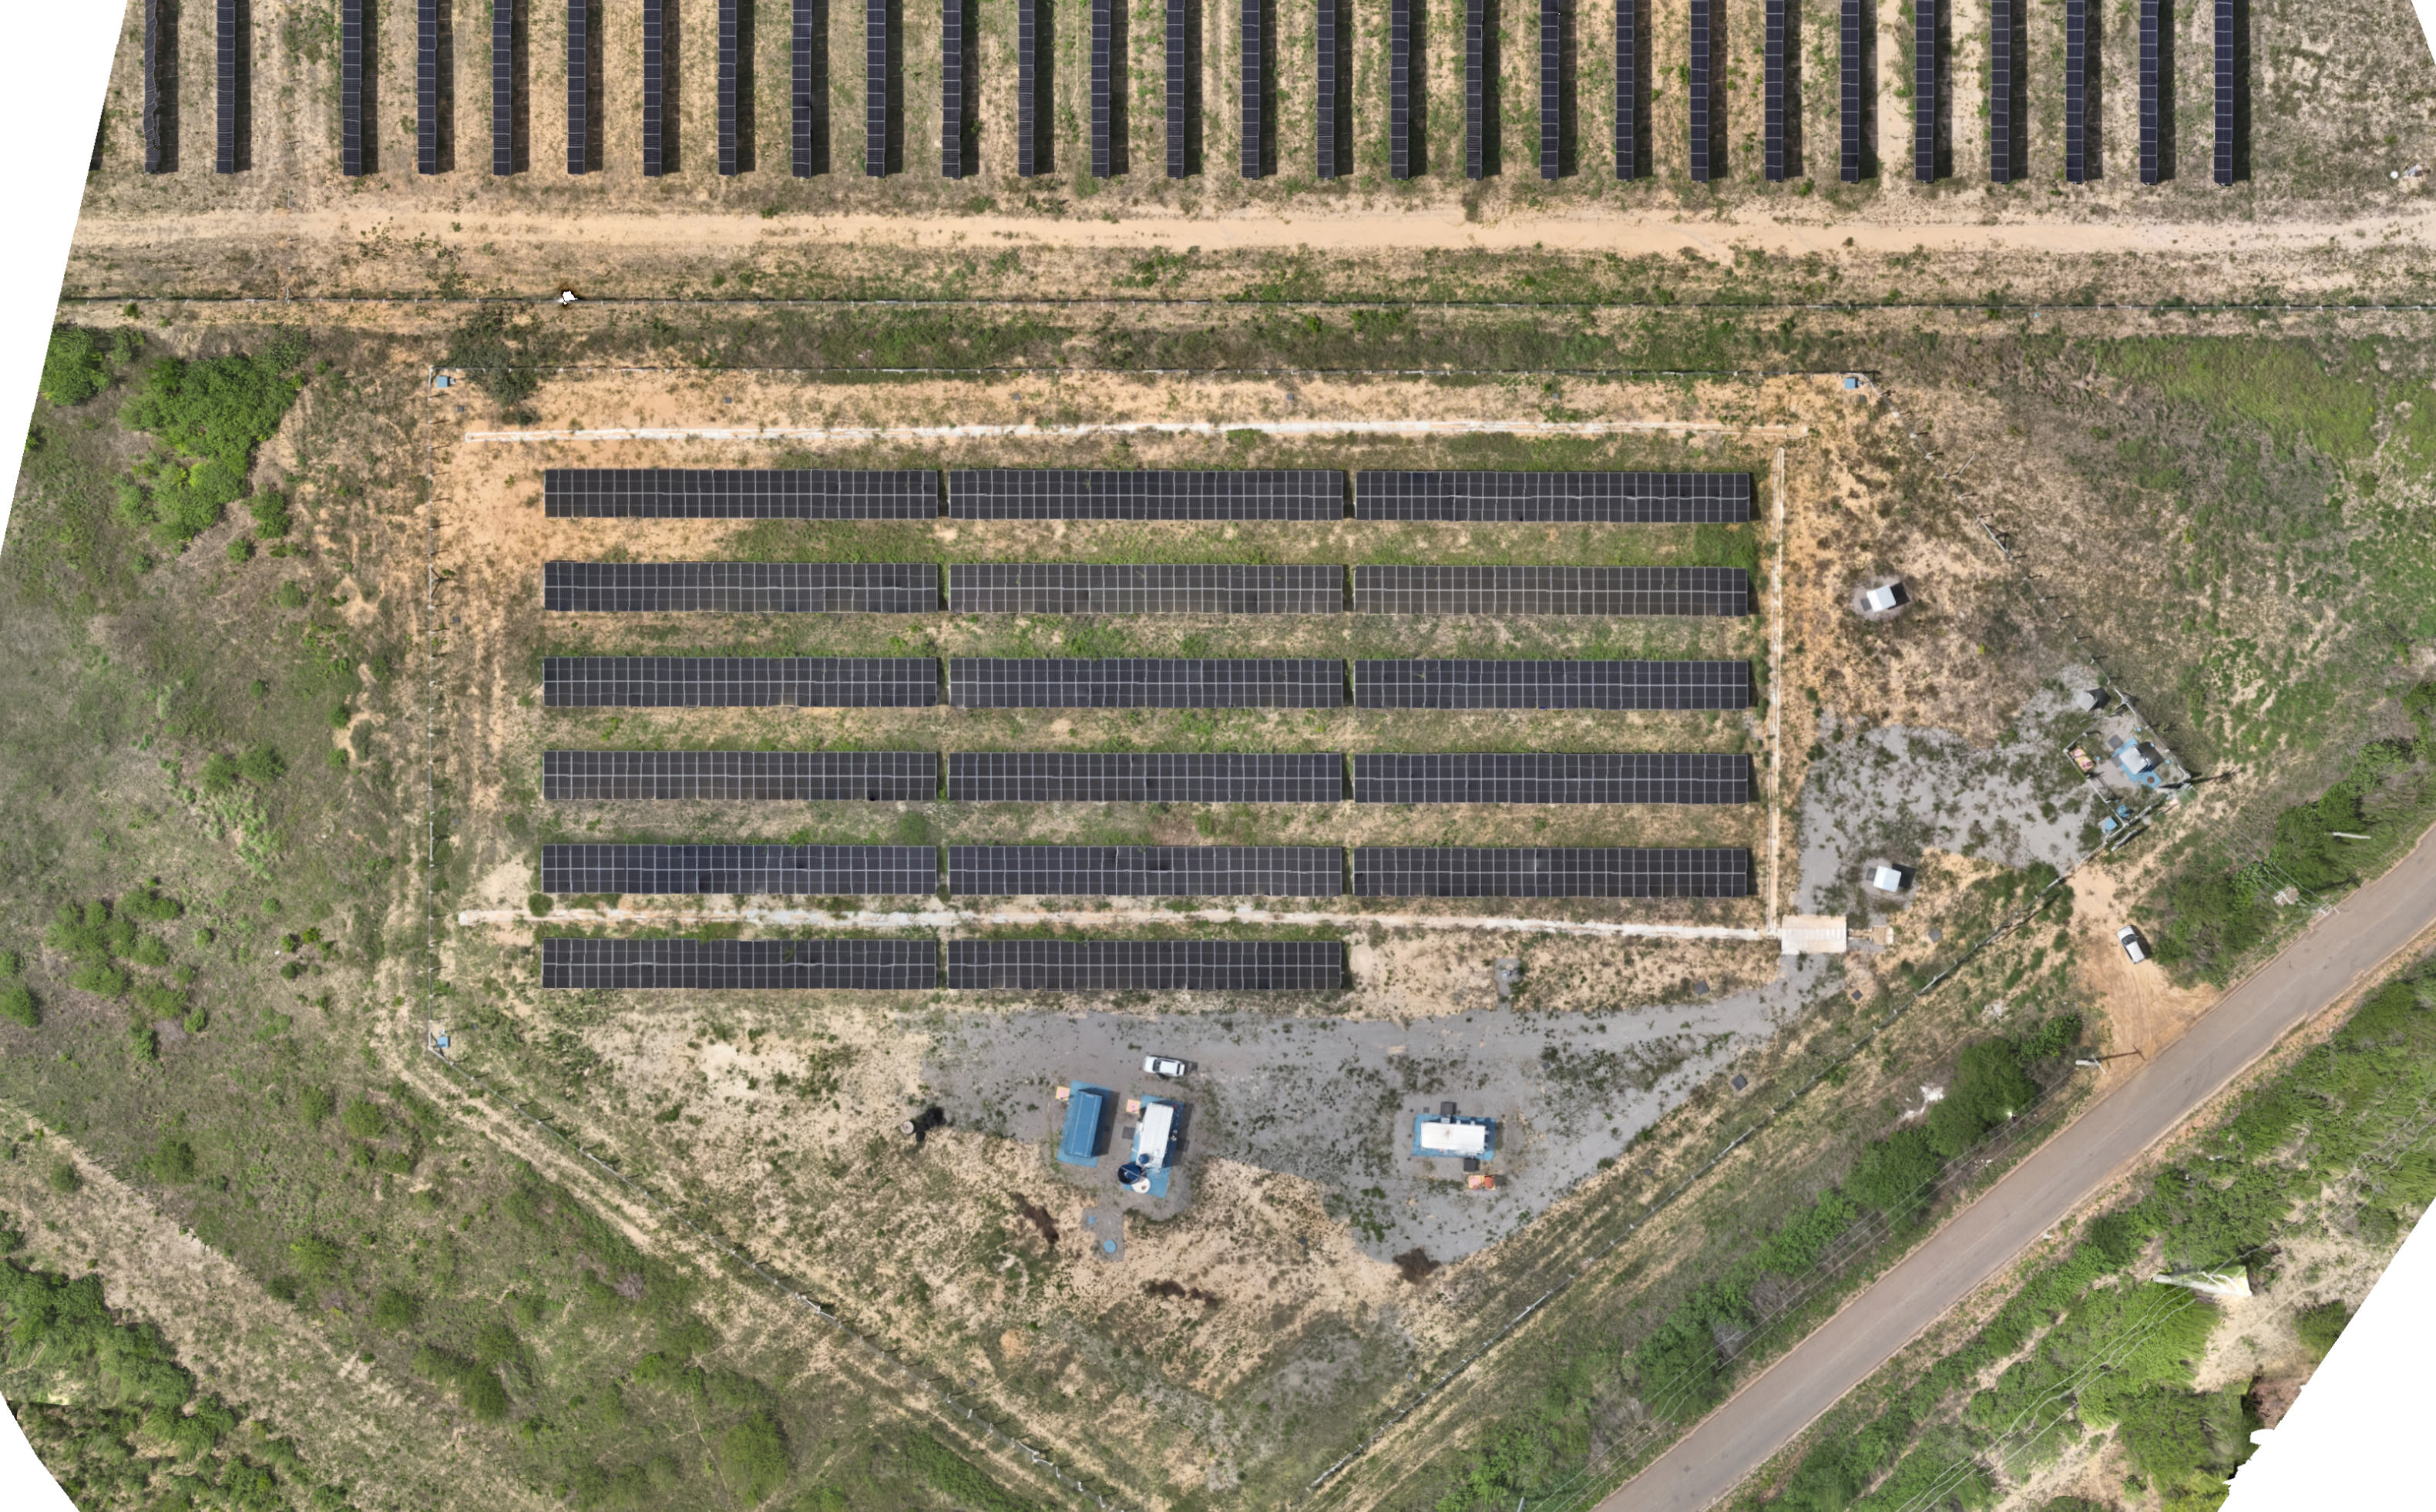
Inspection cases

Dozens of plants inspected, see some

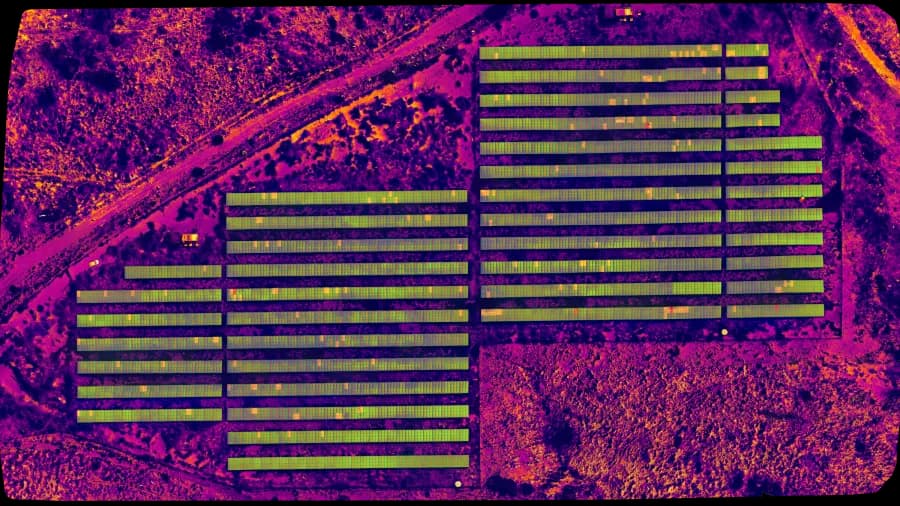
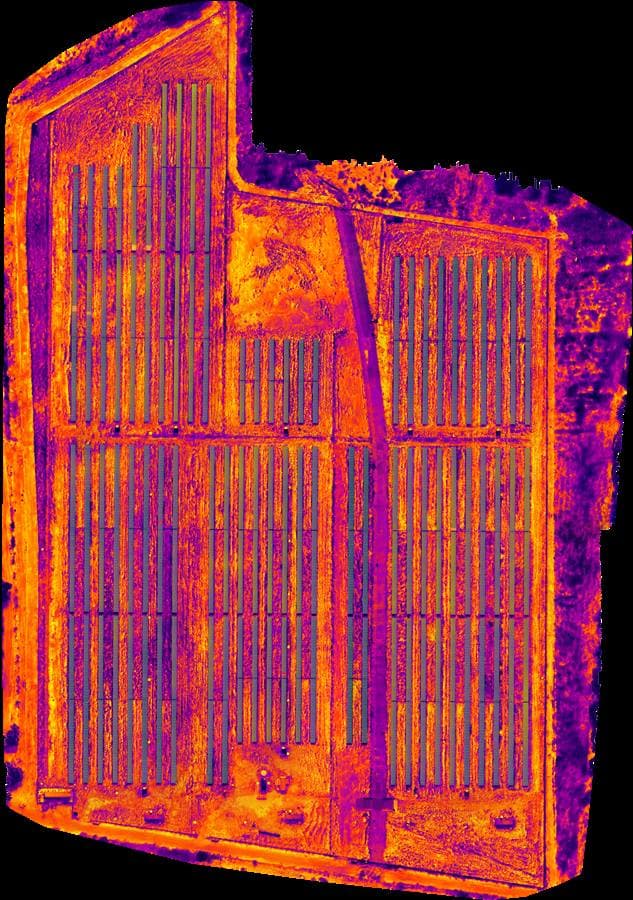
MINAS GERAIS · BR solar inspection
MINAS GERAIS · BR

6,840

PV Modules

1.4%

ANOMALIES (%)
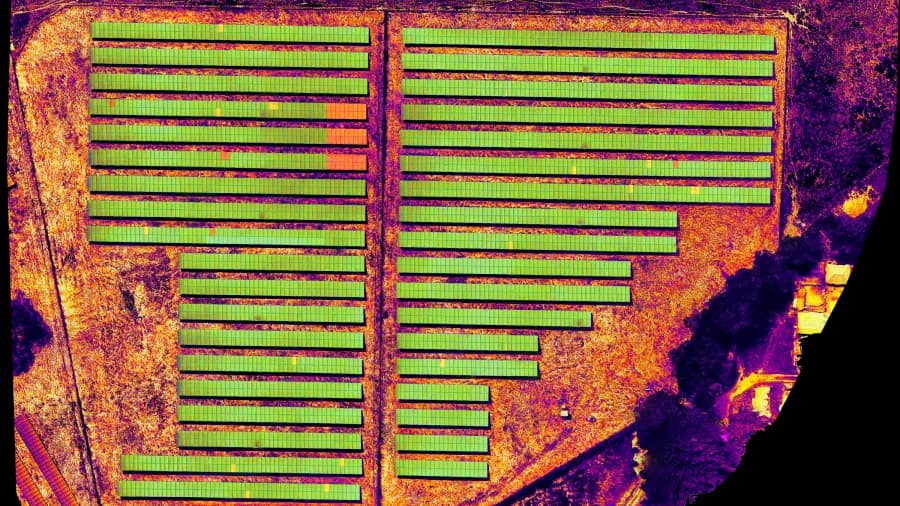
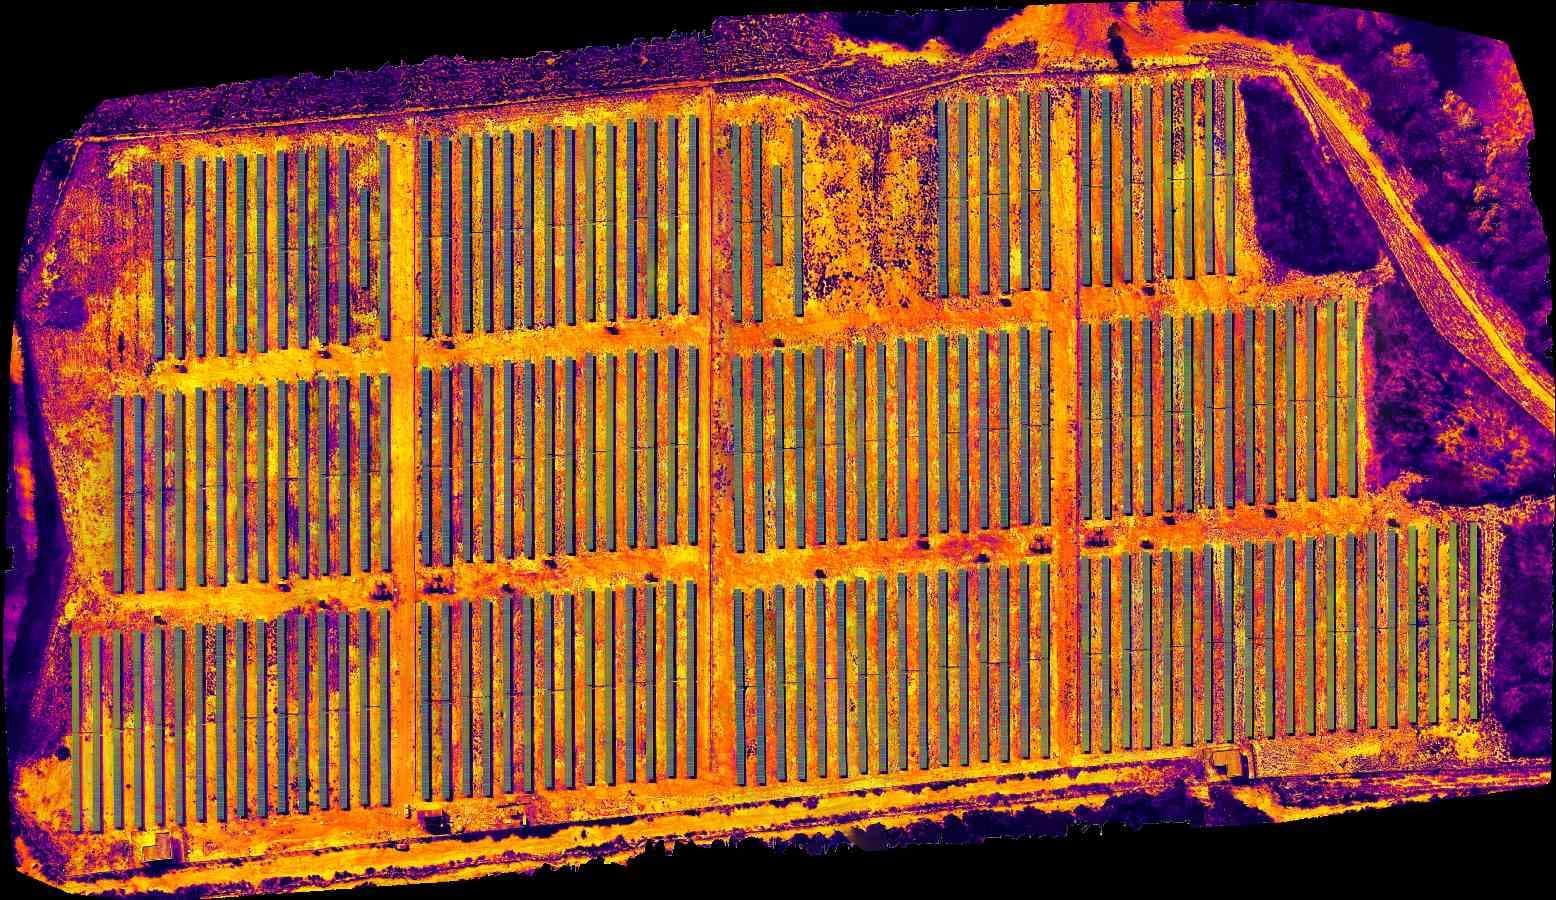
RIO DE JANEIRO · BR solar inspection
RIO DE JANEIRO · BR

5,120

PV Modules

1.8%

ANOMALIES (%)
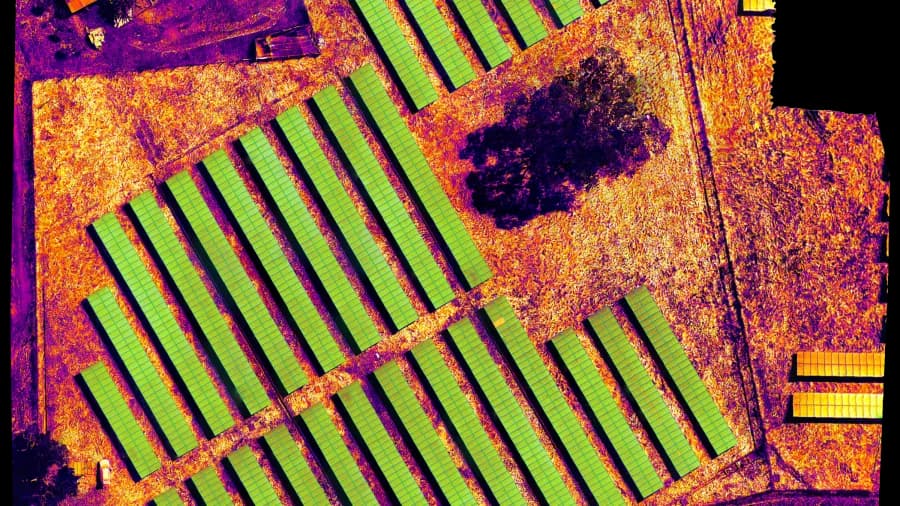
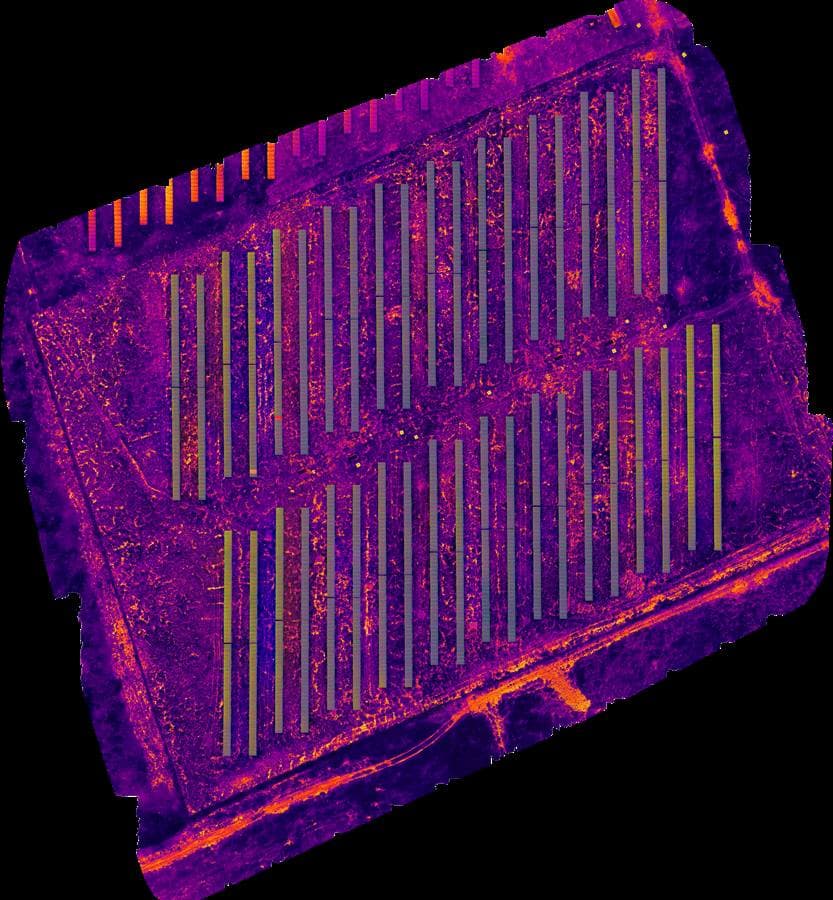
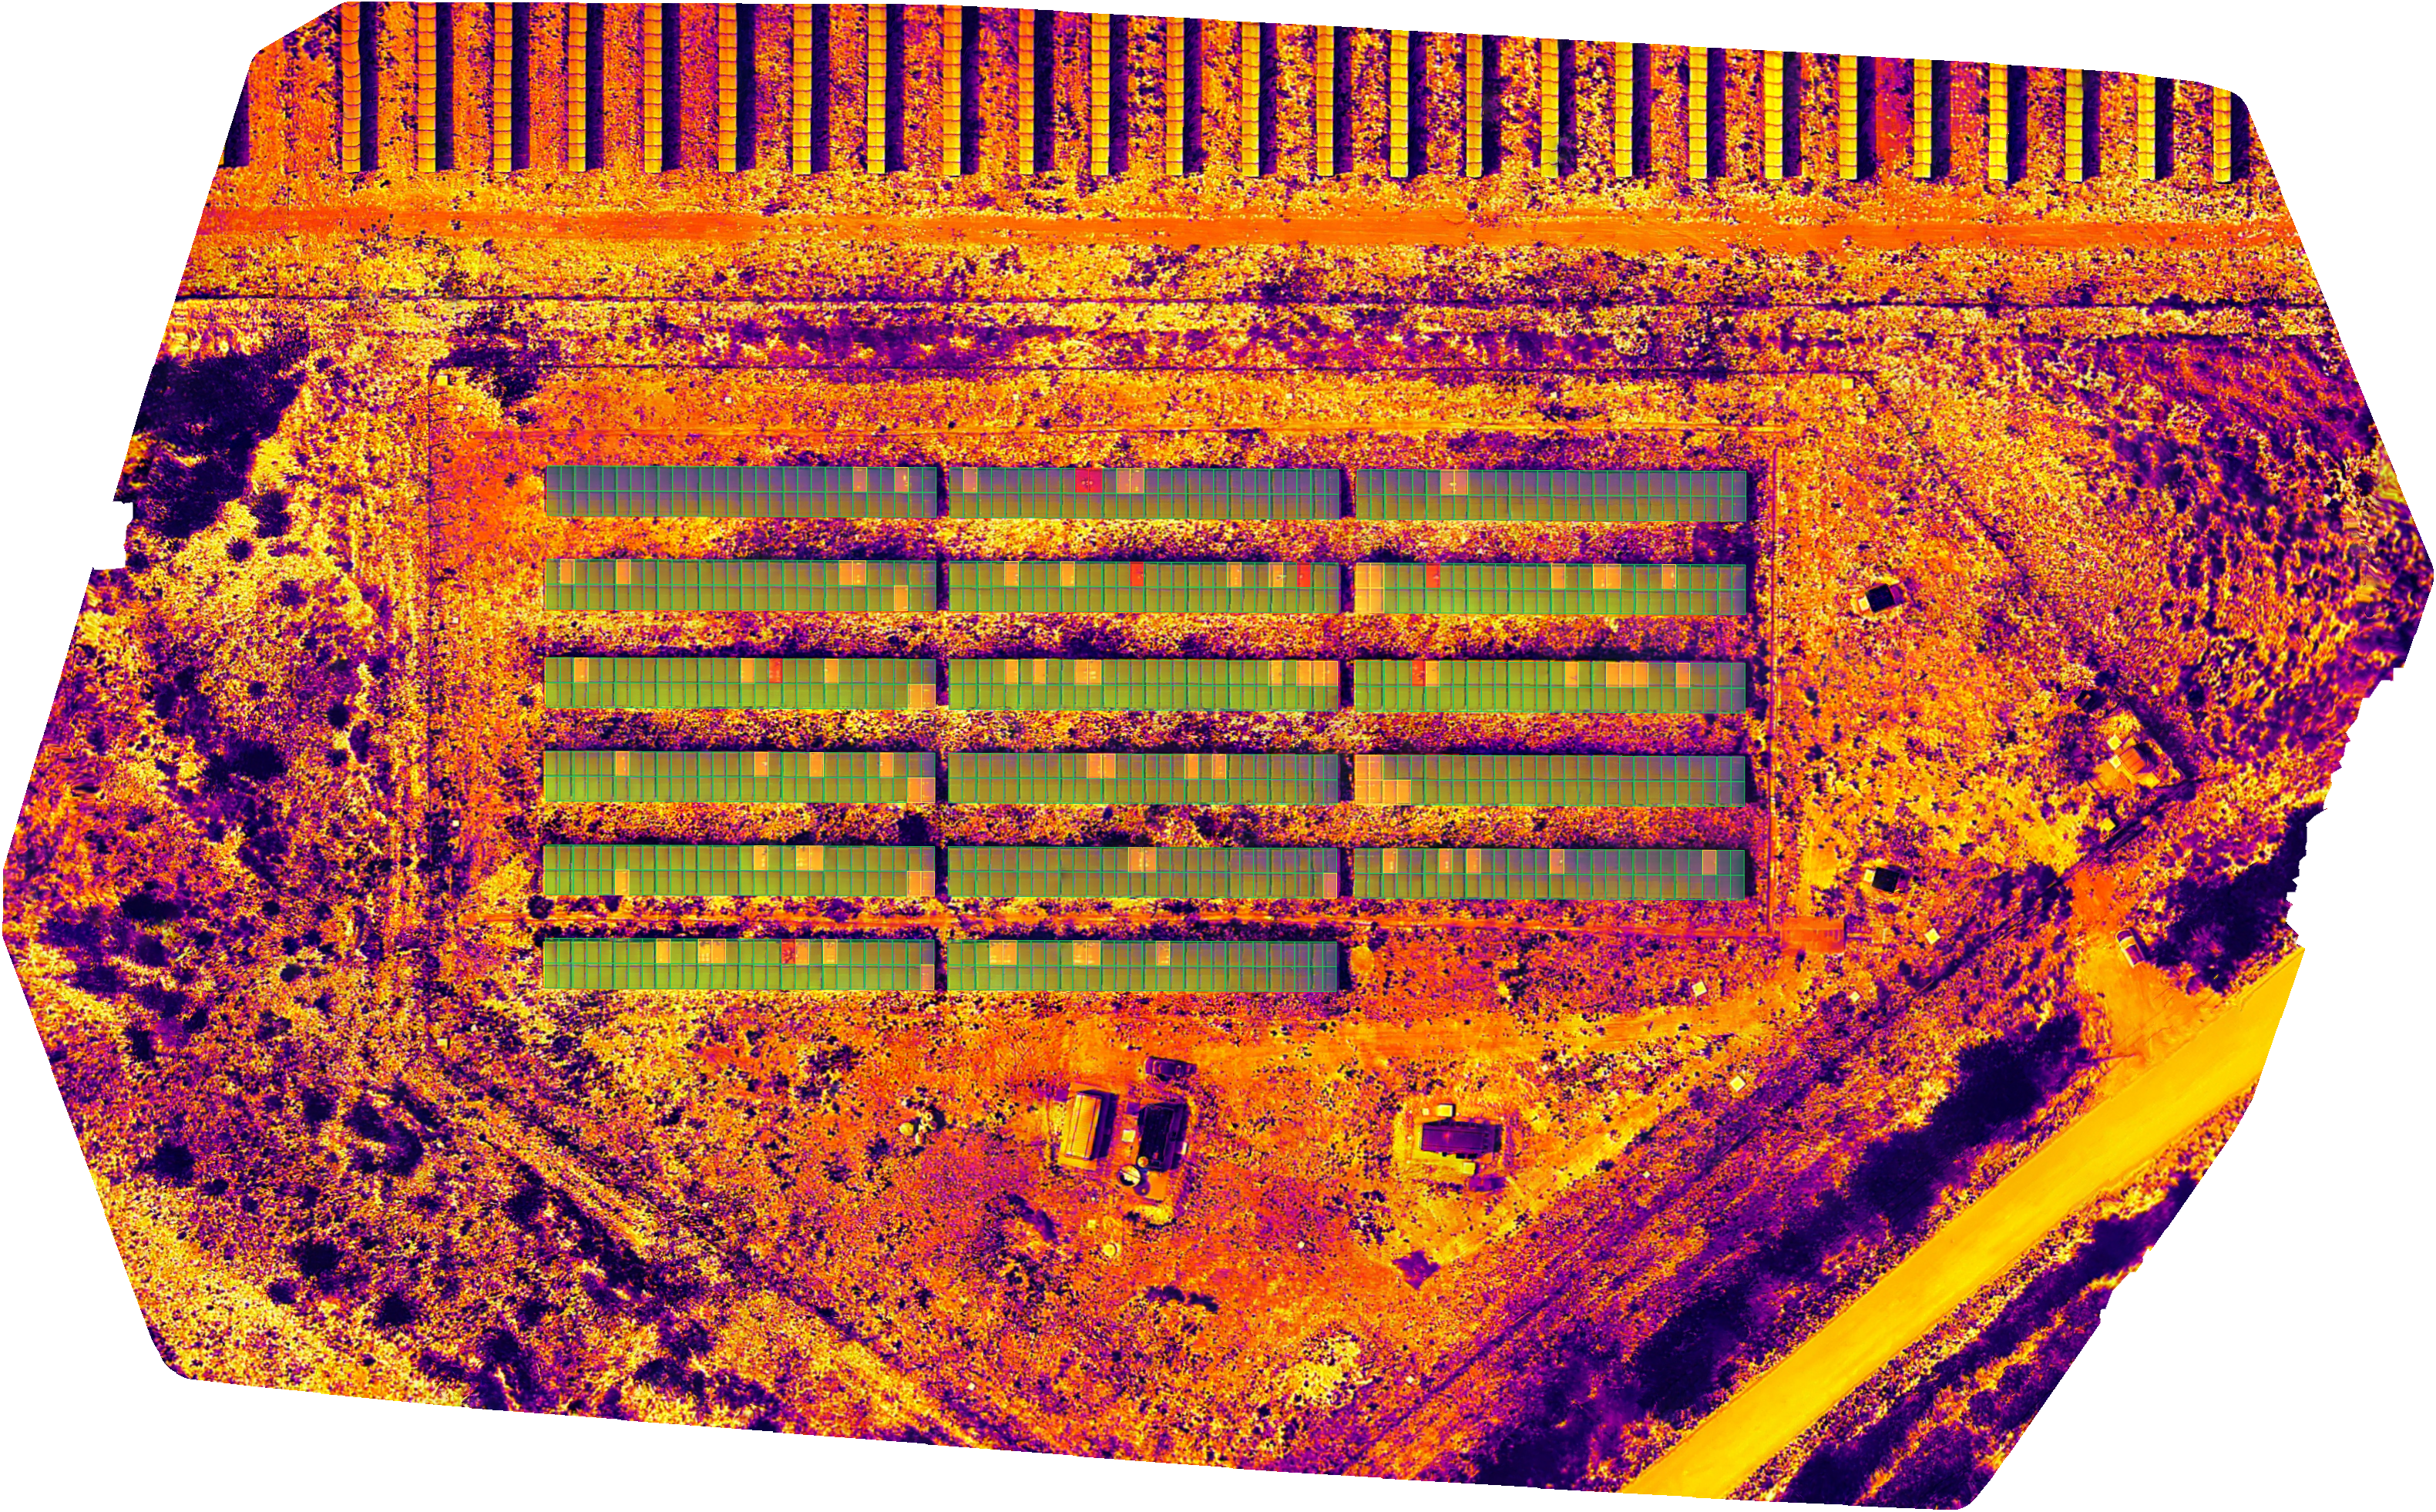
SÃO PAULO · BR solar inspection
SÃO PAULO · BR

4,050

PV Modules

1.1%

ANOMALIES (%)
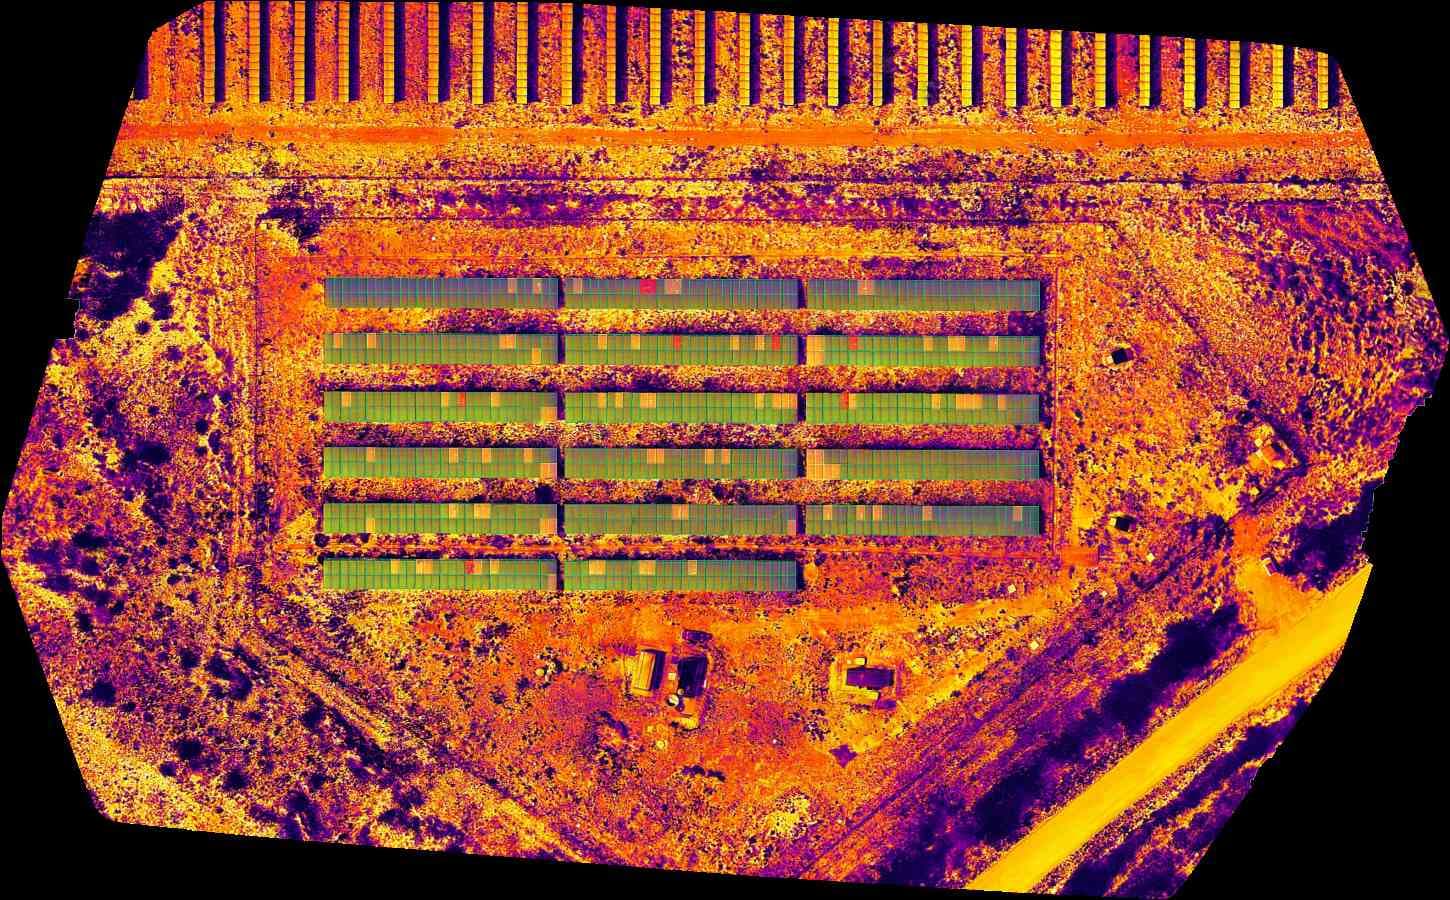
SÃO PAULO · BR solar inspection
SÃO PAULO · BR

2,520

PV Modules

1.6%

ANOMALIES (%)
MINAS GERAIS · BR solar inspection
MINAS GERAIS · BR

5,070

PV Modules

1.3%

ANOMALIES (%)
MINAS GERAIS · BR solar inspection
MINAS GERAIS · BR

9,687

PV Modules

2.1%

ANOMALIES (%)
PIAUÍ · BR solar inspection
PIAUÍ · BR

2,321

PV Modules

0.9%

ANOMALIES (%)
RIO GRANDE DO NORTE · BR solar inspection
RIO GRANDE DO NORTE · BR

952

PV Modules

1.2%

ANOMALIES (%)

Automating our flights and thermal reports with the ZenVision platform was a turning point. What used to take days and hours per MWp is now handled in a fraction of the time, with extremely high precision. Productivity and agility that generate real value for our business.

Dallas FerreiraExata Serviços e Calibrações

OUR PRODUCT

From flight to report, step by step

01

Flight plan

We send the autonomous flight route — just execute it and capture complete thermal and RGB coverage of the plant.

02

Data upload

Upload the raw files to our platform — AI detection, technical analysis and financial impact assessment run automatically.

03

AI fault detection

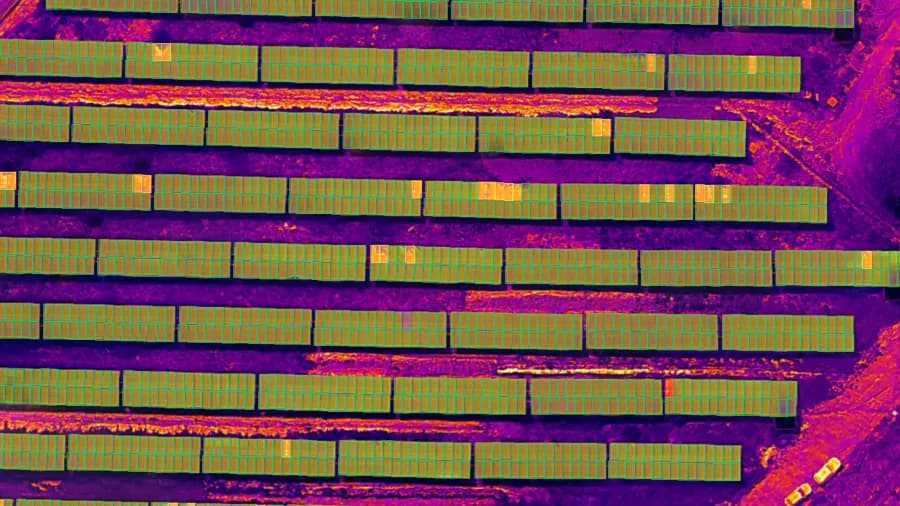
Our models identify over 10 anomaly types — hotspots, bypass diodes, misaligned trackers, shading, cracks and more.

04

Report (under 24h)

Visualize every fault and its priority on the interactive map and export as PDF or CSV — valuable insights for your O&M team.
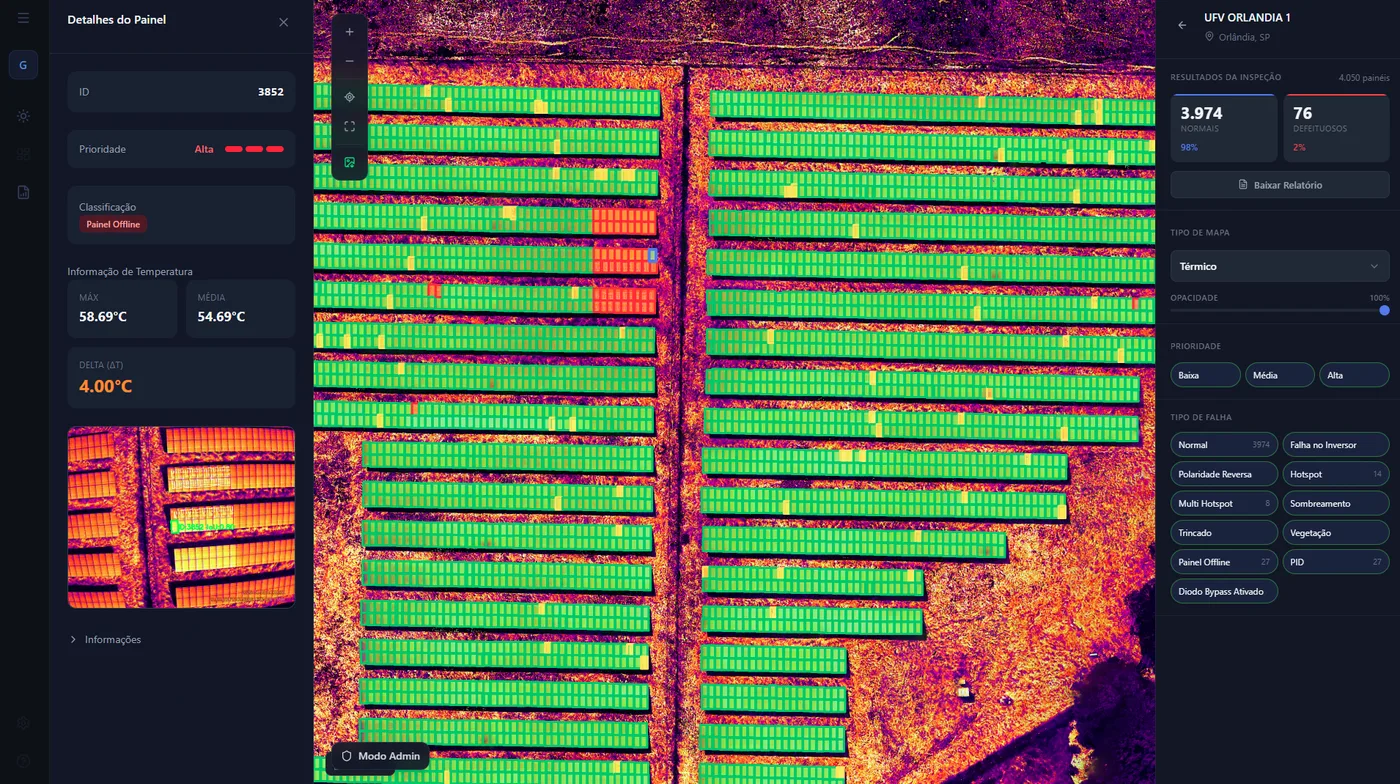
ZenVision platform dashboard

DIFFERENTIALS

Why choose ZenVision?

Cut your next inspection time by up to 90%.
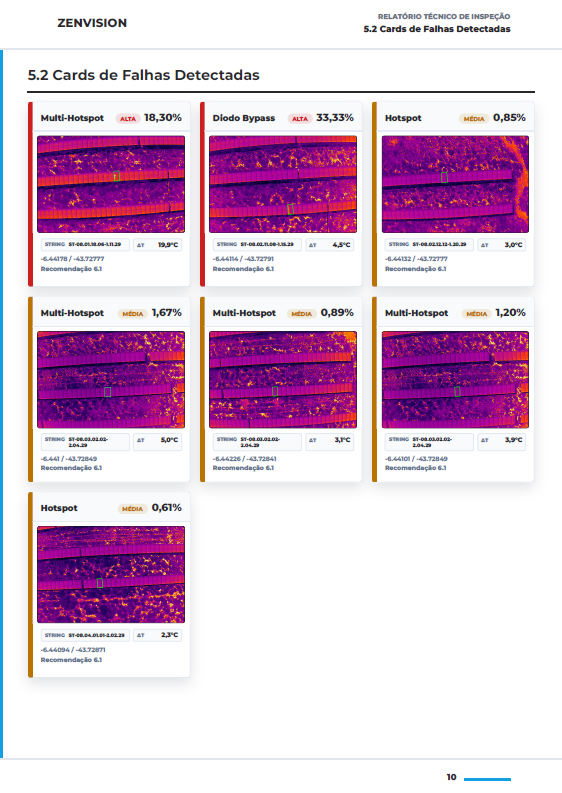
ZenVision report — thermal defect classification
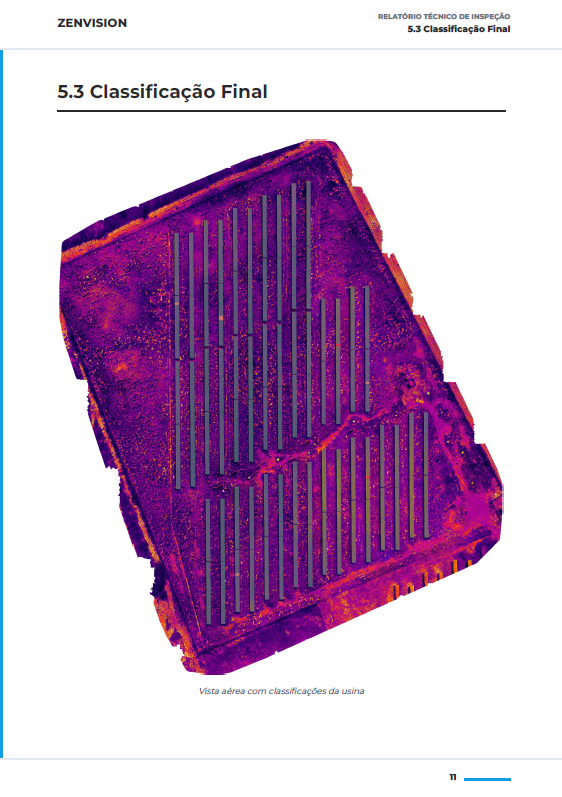
ZenVision inspection report cover
ZenVision report methodology

SAMPLE REPORT

See exactly what you receive

Every ZenVision inspection ends with a professional PDF report — thermal analysis, georeferenced fault map and clear maintenance priorities. Delivered in under 24h, ready to act on.

Delivered in under 24h

Complete PDF report

Georeferenced module map

ROI CALCULATOR

Simulate your savings

50 MWp

Estimate based on the STEMIS model: R$ 450/MWp per inspection, an analyst at R$ 10,000/month, 0.5 MWp analysed per business day and 1,500 MWh generated per MWp per year. Actual values may vary.

Annual savings

R$ 97.500

/year · R$ 8.125 per month

/yearper MWhManual methodR$ 120.000R$ 1,60ZenVisionR$ 22.500R$ 0,30

Equivalent effort: 0,4 dedicated analyst(s).
Inspection time: 100 business days → ~25 h processing

81%

Cost reduction

99%

Time reduction

Request a personalized quote

PLANS

Pick the plan that fits your operation

Priced by inspected volume, with reporting, field app and technical support included. No setup fee.

C&I

Commercial and industrial plants

Starter

US$ 0.10/kWp

US$ 300/month

  • 3,000 kWp per month
  • 2 people in your organization
  • US$ 0.13/kWp additional
  • 12 months of data available
  • 72h report turnaround
  • Field app access
  • Orthomosaic generation
Multi-Asset

Distributed asset portfolios

Basic

US$ 88/MWp

US$ 880/month

  • 10 MWp per month
  • 4 people in your organization
  • US$ 100/MWp additional
  • 12 months of data available
  • 72h report turnaround
  • Field app access
  • Orthomosaic generation
Most popular

Pro

US$ 60/MWp

US$ 1,500/month

  • 25 MWp per month
  • 8 people in your organization
  • US$ 80/MWp additional
  • 24 months of data available
  • 24h report turnaround
  • Field app access
  • Orthomosaic generation
  • White Label report

Enterprise

US$ 46/MWp

US$ 2,300/month

  • 50 MWp per month
  • Unlimited people in your organization
  • US$ 60/MWp additional
  • 36 months of data available
  • 24h report turnaround
  • Field app access
  • Orthomosaic generation
  • White Label report
  • API access
Utility

Utility-scale plants

Scale

On request

  • Above 20 MWp per plant
  • 8 people in your organization
  • 12 months of data available
  • 72h report turnaround
  • Field app access
  • White Label report

Swipe to see every plan

QUESTIONS

Frequently Asked Questions

Get answers to your questions about our platform and services

Let's talk

If you made it here, we should talk.

Tell us a bit about your operation and we'll reach out.

Portfolio size (MWp)

Plants to inspect

Do you own a drone?

Urgency